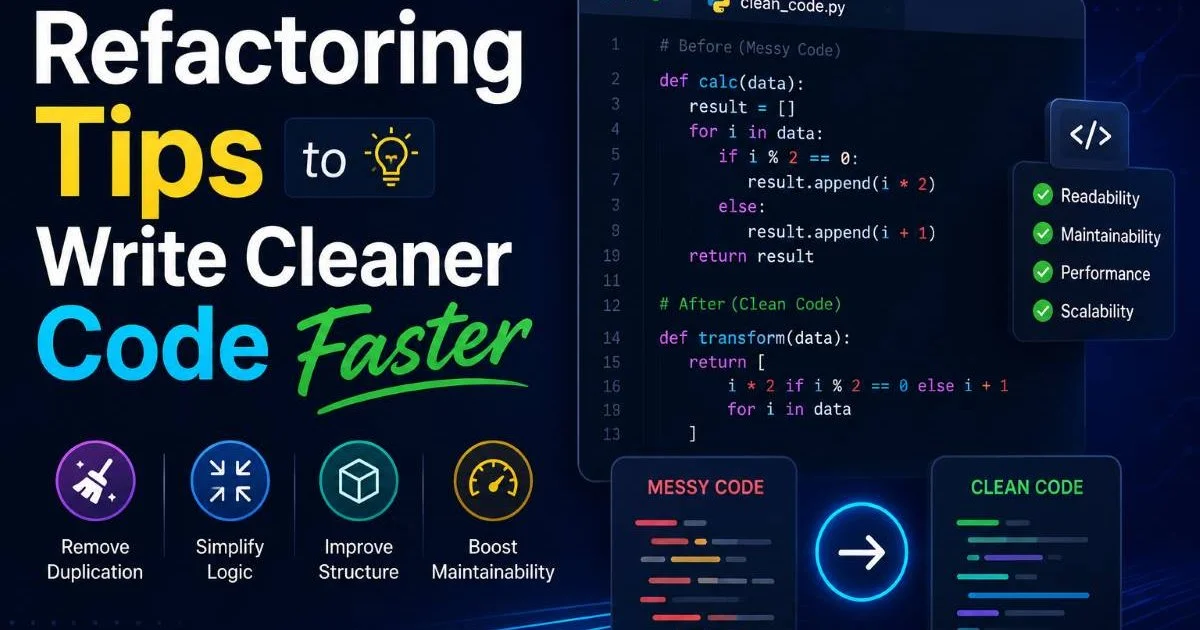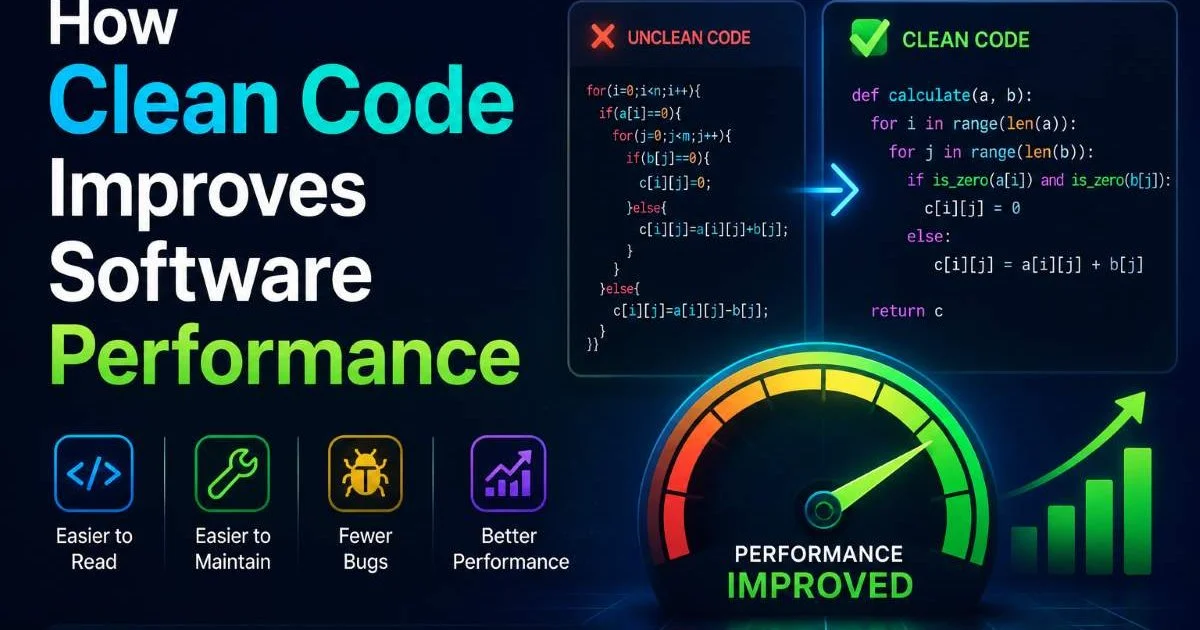
Clean code and software performance are deeply connected, even though many developers treat them as separate concerns. When you apply code optimization techniques to write cleaner, more readable software, the performance benefits often follow naturally. Messy codebases hide inefficiencies: duplicated logic, unnecessary object creation, bloated dependency chains, and convoluted control flow that compilers and runtimes struggle to optimize.
Refactoring tips that seem purely aesthetic, like extracting methods or reducing nesting, frequently expose algorithmic waste you didn't know existed. Writing scalable code starts with writing code that humans can actually understand and reason about.
This guide walks through four concrete steps to improve your software's performance by improving its cleanliness. If you're new to the fundamentals, understanding what code optimization actually means and how it works provides a solid foundation before going further.
Key Takeaways
- Readable code makes performance bottlenecks visible and easier to fix.
- Small, focused functions enable better compiler optimizations and CPU cache usage.
- Removing dead code and unused dependencies directly reduces runtime overhead.
- Consistent naming and structure make profiling results actionable for your team.
- Clean abstractions prevent premature optimization while keeping refactoring paths open.
Step 1: Eliminate Dead Code and Redundant Logic
Identifying Dead Code
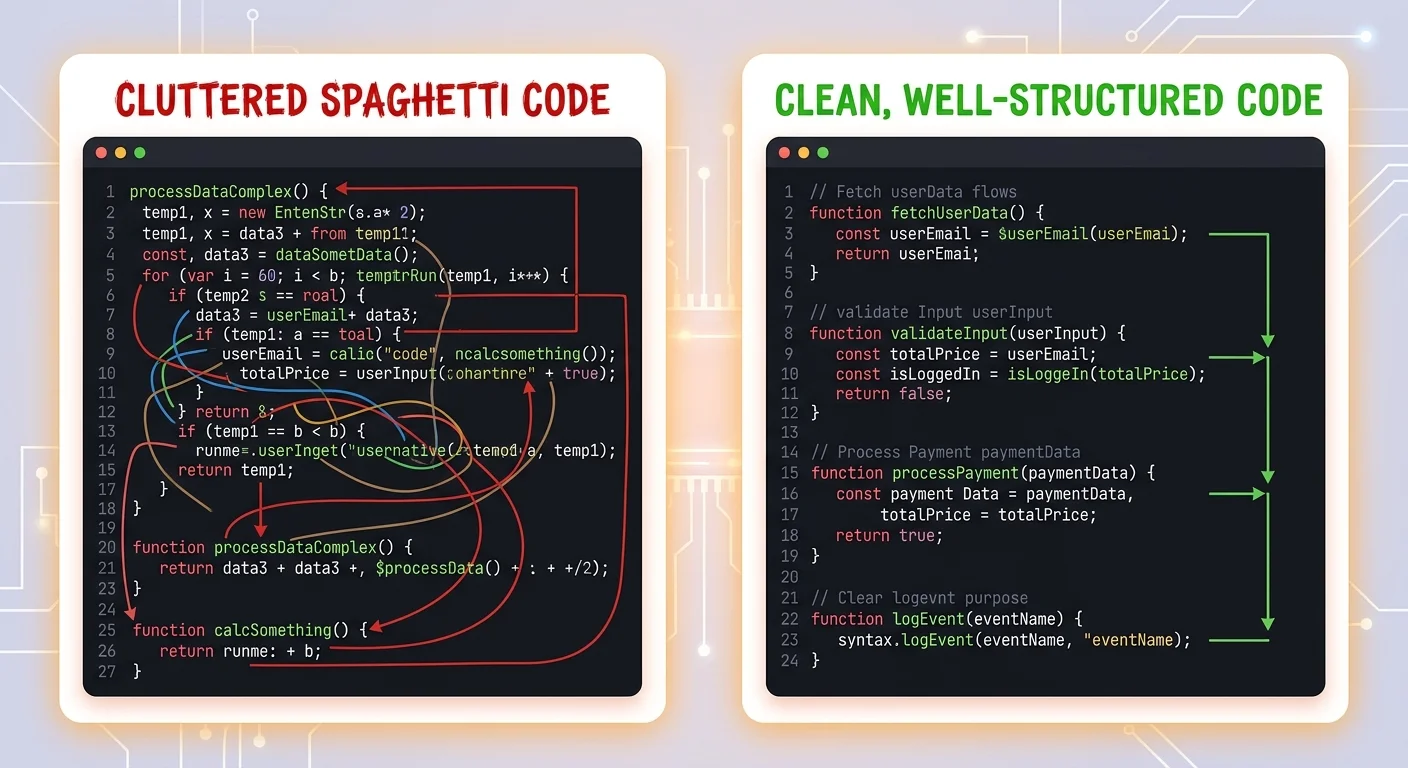
Dead code is any code path that never executes: unused functions, unreachable branches after early returns, deprecated feature flags that nobody toggled in two years. It costs you more than just screen real estate. The compiler may still parse and partially process it, your IDE slows down indexing it, and developers waste cognitive cycles reading around it. In large Java or C# projects, dead code can account for 10 to 20 percent of the total codebase, creating noise that masks real performance issues underneath.
Start with static analysis tools. In JavaScript, tree-shaking via Webpack or Rollup eliminates unused exports at build time, often reducing bundle sizes by 30 percent or more. For Java, IntelliJ's "Inspect Code" feature flags unreachable methods. In Python, vulture scans for unused functions and variables. Run these tools as part of your CI pipeline so dead code doesn't accumulate between sprints. The removal process itself rarely takes long; the hard part is building the habit.
Add dead code detection to your CI pipeline so it runs automatically on every pull request.
Removing Redundant Computations
Redundant computations are subtler than dead code because the code does execute, just more often than necessary. A classic example: recalculating a derived value inside a loop when it could be computed once outside. Or calling array.length on every iteration in languages where that triggers a property lookup rather than reading a cached integer. These micro-inefficiencies compound quickly in hot paths. When your code is clean and well-structured, these patterns stand out visually during code review.
Memoization is another powerful technique for eliminating redundancy. If a pure function is called repeatedly with the same arguments, caching the result can cut execution time dramatically. React's useMemo and Python's functools.lru_cache are well-known implementations. But be selective: memoizing everything adds memory overhead and cache management complexity. The rule of thumb is to memoize when the computation is expensive and the input space is bounded. Clean code makes it obvious where memoization belongs because the function boundaries are clear.
Step 2: Write Small, Focused Functions for Better Optimization
Why Function Size Matters for Performance
There's a direct relationship between function size and how well your runtime can optimize it. The V8 JavaScript engine, for example, has historically struggled to inline or optimize functions that exceed roughly 600 bytes of bytecode. The JVM's JIT compiler applies similar thresholds. When you write a 200-line method that handles validation, business logic, and database access all in one place, the optimizer effectively throws up its hands. Smaller functions give the runtime more opportunities to inline, eliminate dead branches, and keep hot code in the instruction cache.
Beyond compiler behavior, small functions are easier to profile. When a profiler tells you that processOrder() takes 450ms, that's nearly useless if the function spans 300 lines. But when it's composed of validateOrder(), calculateTotals(), and persistOrder(), the profiler pinpoints exactly which sub-operation is slow. This is where clean code directly translates to faster iteration on performance problems. You spend less time hunting and more time fixing.
Practical Extraction Patterns
Extract Method is the most common refactoring pattern, and it's the workhorse of clean code optimization techniques. Identify a block of code that does one distinct thing, give it a descriptive name, and move it to its own function. Watch for three signals: comments explaining what a block does (the comment should be the function name), deeply nested conditionals, and code that requires you to scroll to understand. Modern IDEs automate this extraction safely, preserving behavior while improving structure.
Guard clauses are another pattern worth adopting. Instead of wrapping an entire function body in an if block, return early when preconditions fail. This flattens your code, reduces indentation, and lets the CPU's branch predictor work with a more linear execution path. In benchmarks on tight loops, replacing nested conditionals with early returns has shown measurable improvements, particularly in C++ and Rust where branch prediction misses carry real penalties. These refactoring tips are small individually but compound across an entire codebase.
Step 3: Use Clean Data Structures and Access Patterns
Choosing Structures That Match Your Access Pattern
The wrong data structure can tank performance no matter how clean your logic is. A common mistake in web applications is using arrays for lookups by key, turning an O(1) hash map operation into O(n) linear scans. In one real-world Node.js API, switching from filtering an array of 10,000 user objects to using a Map for lookups reduced a critical endpoint's response time from 120ms to 8ms. Clean, well-named code makes these structural choices visible. When you name a variable userLookupMap instead of data, the intent and performance characteristics are immediately clear.
| Operation | Array | HashMap/Map | Linked List | Binary Tree |
|---|---|---|---|---|
| Lookup by key | O(n) | O(1) | O(n) | O(log n) |
| Insert at end | O(1)* | O(1) | O(1) | O(log n) |
| Delete by value | O(n) | O(1) | O(n) | O(log n) |
| Ordered iteration | O(n) | O(n log n) | O(n) | O(n) |
| Memory locality | Excellent | Moderate | Poor | Moderate |
Amortized O(1) for array insertion assumes no reallocation is needed. Pre-allocating capacity avoids this cost.
Reducing Memory Allocation Churn
Garbage-collected languages like Java, C#, Go, and JavaScript suffer measurably when code creates and discards objects at high frequency. Each allocation puts pressure on the garbage collector, and GC pauses can spike latency in ways that are hard to diagnose. Clean code reduces allocation churn naturally. When you avoid creating temporary objects inside loops, reuse buffers, and prefer primitive types over boxed objects, you're simultaneously writing cleaner and faster code. The performance improvement is especially noticeable in server-side applications handling thousands of requests per second.
Object pooling is a clean pattern for high-throughput scenarios. Database connection pools are the most familiar example, but the same principle applies to byte buffers, thread-local formatters, and even domain objects in game engines. The key is to encapsulate the pooling behind a clean API so callers don't manage lifecycle details. Tools like AI-powered coding assistants can help identify allocation hotspots and suggest pooling patterns, accelerating the refactoring process significantly for teams working on performance-sensitive applications.
"The cleanest code often turns out to be the fastest code, because clarity exposes waste that complexity hides."
Step 4: Profile, Then Refactor with Clean Code Principles
Profiling Clean vs. Messy Codebases
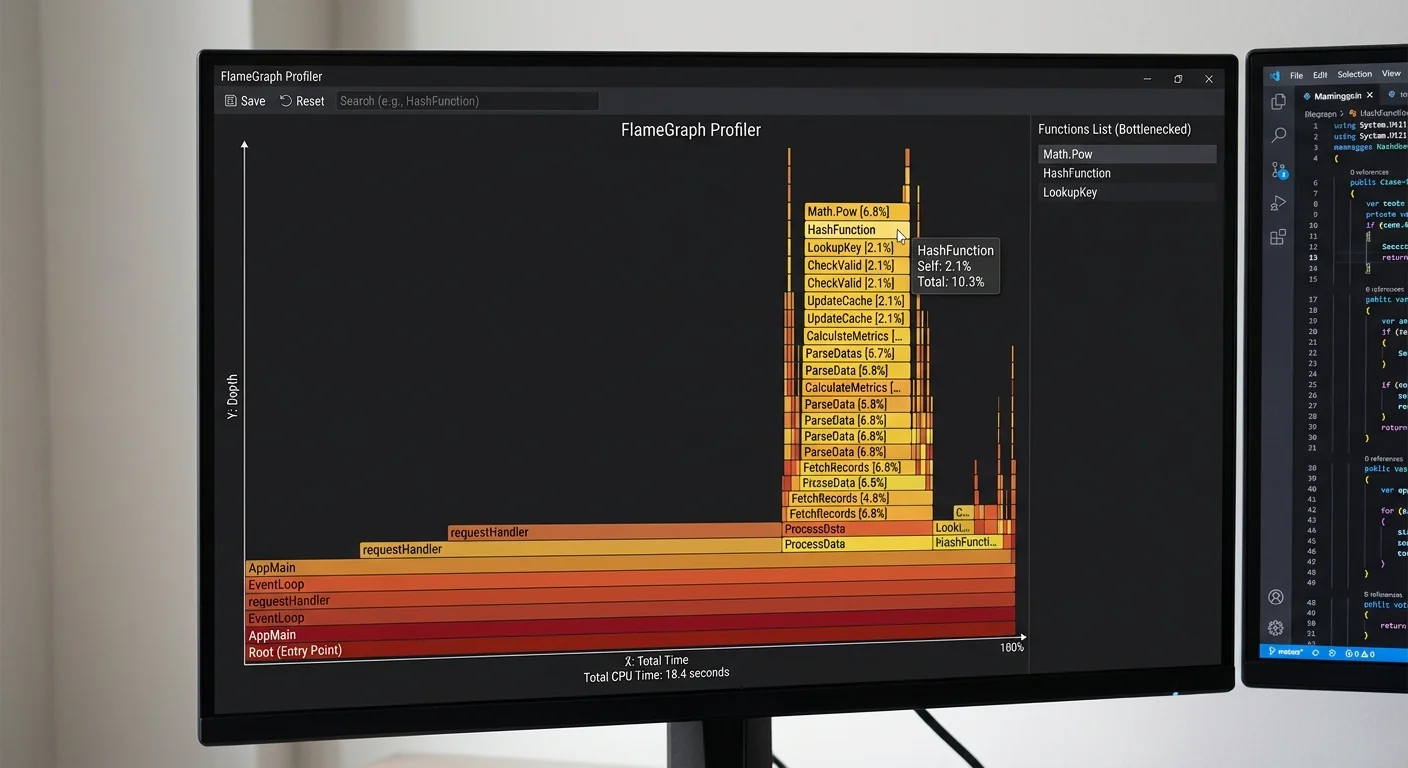
Profiling a messy codebase feels like reading a blurry map. Flame graphs show enormous monolithic functions consuming time, but you can't tell which internal operation is responsible. Clean codebases produce profiling output that reads like a story: handleRequest calls authenticateUser (2ms), then fetchInventory (85ms), then renderResponse (12ms). The bottleneck is instantly obvious. This is why clean code and software performance optimization aren't sequential activities but parallel ones. Investing in readability pays dividends every time you reach for a profiler.
Use the right profiler for your stack. Chrome DevTools and Node.js's built-in --prof flag work well for JavaScript. Java developers should reach for async-profiler or JFR (Java Flight Recorder) rather than relying on sampling profilers that add overhead. Python's cProfile is a solid starting point, though py-spy provides sampling without modifying your code. Regardless of tool, profile in conditions that mirror production: realistic data volumes, concurrent users, and warm caches. Synthetic benchmarks on toy data will mislead you.
Iterative Refactoring Workflow
The most effective workflow combines profiling and refactoring into a tight loop. First, profile to identify the top three hotspots. Then, refactor only those areas using clean code principles: extract methods, simplify conditionals, choose better data structures. Profile again to measure the impact. Repeat. This disciplined approach prevents premature optimization, which is the root of considerable wasted engineering time. You only invest effort where measured data shows it matters, and you leave the code cleaner than you found it each time.
Keep a "performance journal" that logs each profiling session, the refactoring applied, and the measured improvement.
Version control discipline matters here too. Make performance refactors in small, isolated commits with clear messages like "Extract payment calculation; reduces allocations in checkout loop." This practice lets you bisect regressions confidently and roll back specific changes if a refactor accidentally degrades performance. It also creates a historical record that helps future developers understand why the code is structured the way it is. Writing scalable code is not a one-time effort; it's an ongoing practice embedded in your development workflow, sustained by the clarity that clean code provides.
Frequently Asked Questions
?How do I add dead code detection to a CI pipeline?
?Is refactoring for clean code worth it if performance gains are small?
?How long does removing dead code typically take in a large codebase?
?Does writing small functions always improve performance, or can it backfire?
Final Thoughts
Clean code and performance optimization are not opposing forces; they reinforce each other at every stage of development. When your functions are small and well-named, profilers give you actionable data. When your data structures match your access patterns, both readability and speed improve.
The four steps outlined here, eliminating dead code, writing focused functions, choosing proper data structures, and profiling iteratively, form a practical loop that makes your software faster and your codebase more maintainable. Start with the messiest, slowest part of your application, and apply these code optimization techniques one commit at a time.
Disclaimer: Portions of this content may have been generated using AI tools to enhance clarity and brevity. While reviewed by a human, independent verification is encouraged.