Code optimization techniques form the backbone of high-performing software, yet many developers skip them early in their careers and pay for it later with sluggish applications and unmaintainable codebases. Whether you're writing a REST API, building a data pipeline, or shipping a front-end application, the way you structure and optimize your code determines how well it scales under real-world pressure.
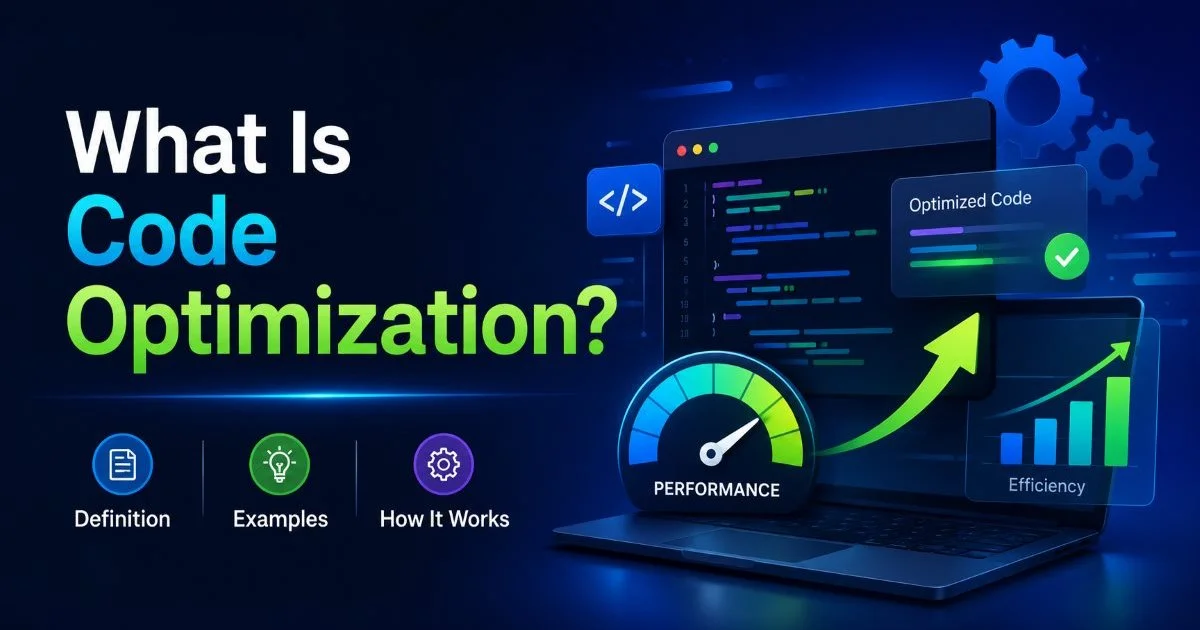
Clean code isn't just about aesthetics; it directly impacts runtime performance, memory consumption, and long-term maintainability. If you want a foundational overview of what code optimization is and how it works, that's a great starting point before diving into the hands-on techniques below.
This guide walks through four actionable categories of optimization, from profiling and algorithm selection to refactoring patterns and scalable architecture. Each section gives you specific, implementable steps rather than vague advice. By the end, you'll have a practical playbook for writing faster, leaner, and more maintainable software.
Key Takeaways
- Always profile before optimizing; data beats intuition when identifying real bottlenecks.
- Choosing the right algorithm often matters more than micro-optimizing existing code.
- Refactoring for readability frequently reveals hidden performance improvements in your codebase.
- Caching and lazy loading are low-effort techniques that yield significant speed gains.
- Scalable code requires deliberate architectural decisions made early in the development cycle.
1. Profile Before You Optimize
Choosing the Right Profiling Tool
The single biggest mistake developers make is optimizing code based on hunches. You might spend hours rewriting a function that accounts for 0.3% of total execution time while the actual bottleneck sits in a database query you never examined. Profiling tools give you hard numbers: CPU time per function, memory allocation patterns, and I/O wait durations. Start with the profiler built into your language's ecosystem before reaching for third-party options.
For Python developers, cProfile and py-spy provide call-level timing data with minimal setup. Java developers should look at VisualVM or async-profiler for production-safe sampling. JavaScript teams can use Chrome DevTools' Performance tab or Node.js's built-in --prof flag. The right tool depends on your runtime, but every modern language has at least one solid option available at no cost.
Run your profiler against realistic production data, not toy inputs. Bottlenecks often only appear at scale.
Interpreting Profiler Output
Once you have profiler output, sort by cumulative time and focus on the top five functions. These are your hot paths, the code that actually consumes the majority of your application's runtime. Flame graphs are particularly useful here because they visualize the call stack and make nested bottlenecks obvious. Don't just look at self-time; a function that calls ten slow helpers will show low self-time but high cumulative time.
After identifying hot paths, categorize each bottleneck as CPU-bound, memory-bound, or I/O-bound. This classification determines which optimization technique applies. A CPU-bound loop needs an algorithmic fix; an I/O-bound database call needs caching or connection pooling. Misdiagnosing the category wastes effort. Profile, classify, then act, in that order.
Profiling in development environments can produce misleading results. Always validate findings against staging or production metrics.
2. Pick Better Algorithms and Data Structures
Common Algorithm Swaps
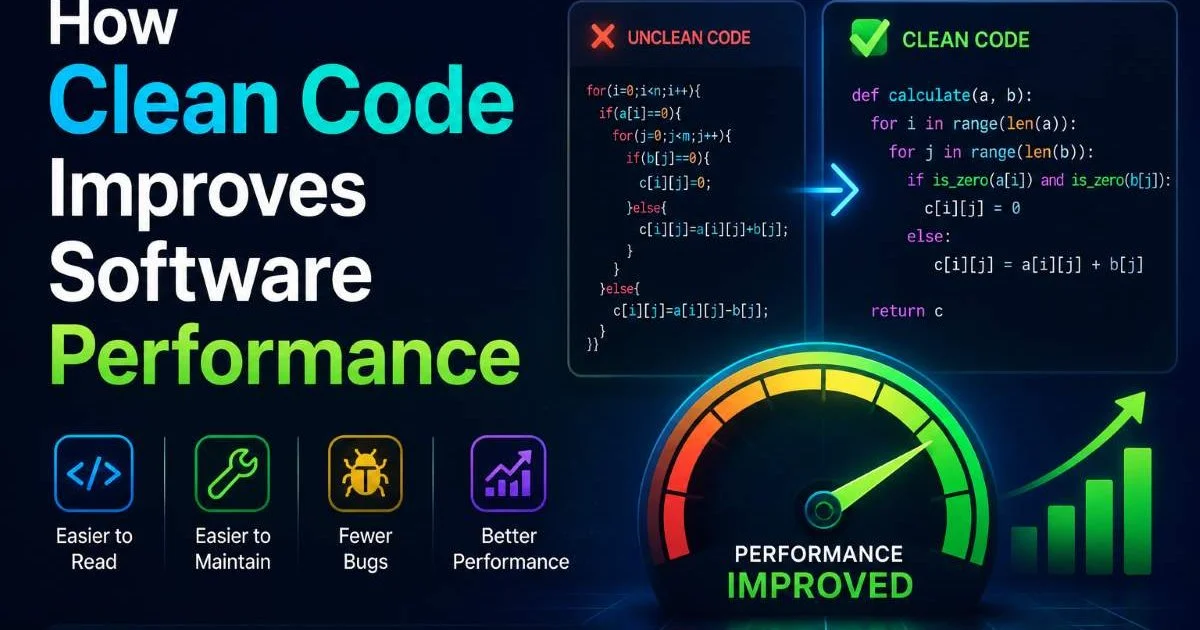
No amount of micro-optimization rescues a fundamentally wrong algorithm. Switching from a nested loop with O(n²) complexity to a hash-based approach with O(n) complexity can turn a function that takes 12 seconds into one that completes in 15 milliseconds. This isn't theoretical; these gains show up routinely in real applications handling moderate datasets. Understanding how clean code improves software performance reinforces why readable algorithm implementations matter alongside raw speed.
Consider a common scenario: checking for duplicate entries in a list. A naive approach compares every element against every other element. Replace that with a set or hash map, and you eliminate the inner loop entirely. The same principle applies to search operations (binary search over linear scan), sorting (avoiding bubble sort for anything beyond trivial datasets), and graph traversals (BFS vs. brute-force path enumeration).
Data Structure Selection
Your choice of data structure shapes performance just as much as the algorithm itself. Arrays give you O(1) random access but O(n) insertion. Linked lists flip that tradeoff. Hash maps provide near-constant lookups but consume more memory and lose ordering. Trees maintain sorted data with O(log n) operations across the board. Picking the right structure for your access pattern is a core optimization technique that many developers overlook.
| Data Structure | Lookup | Insert | Delete | Memory Overhead |
|---|---|---|---|---|
| Array / List | O(1) index, O(n) search | O(n) | O(n) | Low |
| Hash Map | O(1) average | O(1) average | O(1) average | High |
| Binary Search Tree | O(log n) | O(log n) | O(log n) | Moderate |
| Linked List | O(n) | O(1) at head | O(1) with ref | Moderate |
| Heap / Priority Queue | O(n) | O(log n) | O(log n) | Low |
When you're uncertain, benchmark two candidates with realistic data. A hash map might win on paper, but if your dataset is tiny (under 50 elements), a simple array scan often outperforms it due to cache locality. Context always matters more than theoretical complexity classes, so measure before committing.
Premature data structure optimization can increase code complexity without measurable benefit. Benchmark first.
3. Refactor for Clarity and Speed
Extract and Simplify
Refactoring and optimization are related but distinct activities, and understanding the key differences between code refactoring and optimization helps you apply each at the right time. That said, good refactoring often uncovers performance wins. When you extract a 200-line method into smaller, focused functions, you frequently notice redundant calculations, unnecessary object allocations, or repeated database calls that were hidden inside the monolith.
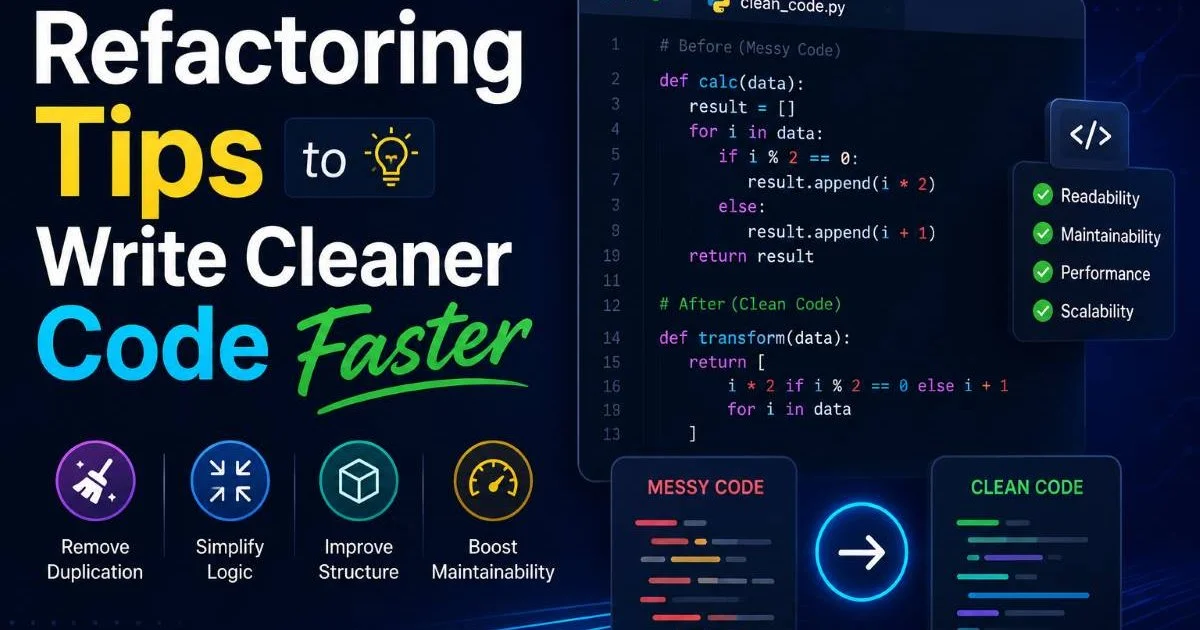
Start with the "extract method" pattern. Identify blocks of code inside a function that perform a distinct task and pull them into their own named functions. This makes the logic easier to test, profile, and optimize independently. A function called calculateShippingCost() is easier to reason about than lines 47 through 89 of processOrder(). Naming forces you to clarify intent, and clarity often reveals waste. For more patterns like this, check out these refactoring tips to write cleaner code faster.
"The best optimization is often the code you remove, not the code you rewrite."
Eliminate Waste
Dead code, unused imports, redundant computations, and unnecessary object creation all add up. A loop that creates a new StringBuilder or DateFormatter on every iteration wastes allocation and GC cycles. Moving that instantiation outside the loop is a trivial change with measurable impact. Similarly, check for computations whose results never get used; compilers catch some of these, but interpreted languages rarely do.
Another common source of waste is over-fetching data. If your function only needs three columns from a database table, don't select all twenty. If your API returns a 500-field JSON object but the client uses twelve fields, implement a projection layer. These aren't glamorous changes, but they reduce memory pressure, network transfer time, and serialization overhead. Small improvements compound across thousands of requests per second.
Automated tools like linters, dead code detectors, and static analyzers help here. ESLint with the no-unused-vars rule catches JavaScript waste. Python's vulture finds unreachable code. Java's SpotBugs flags performance anti-patterns. Integrate these into your CI pipeline so waste doesn't accumulate between refactoring sessions. The effort to set them up is minimal; the ongoing payoff is substantial.
Schedule quarterly "code cleanup" sprints to address accumulated technical debt before it becomes a performance liability.
4. Design for Scalable Performance
Caching and Lazy Loading
Caching is one of the highest-return optimization techniques available. If a computation is expensive and its inputs don't change frequently, cache the result. This applies at every level: in-memory caches for function results (memoization), application-level caches like Redis for database queries, and CDN caches for static assets. The right caching strategy can reduce response times from seconds to single-digit milliseconds.
Lazy loading complements caching by deferring work until it's actually needed. Don't load a user's entire order history when they log in; fetch it when they click the "Orders" tab. Don't initialize every service dependency at application startup; use lazy initialization so services spin up on first use. This reduces startup time, lowers peak memory consumption, and improves perceived performance for end users. Modern frameworks from React to Spring support lazy loading natively.
Architectural Patterns for Growth
Scalable code doesn't happen by accident. It requires architectural decisions made early, like separating read and write paths (CQRS), using message queues for async processing, and designing stateless services that can scale horizontally. These patterns prevent you from hitting a wall when traffic doubles. If your application stores session state in local memory, you can't add a second server without sticky sessions or a shared store. Planning for statelessness from the start avoids painful rewrites later.
Connection pooling is another architectural optimization that pays dividends at scale. Opening a new database connection for every request adds 20 to 50 milliseconds of overhead. A connection pool maintains a set of reusable connections, dropping that overhead to near zero for most requests. Libraries like HikariCP (Java), pgBouncer (PostgreSQL), and SQLAlchemy's pool (Python) handle this transparently. Modern AI-powered coding tools, including some of the best LLMs for agentic coding, can even suggest these architectural improvements automatically when analyzing your codebase.
Finally, think about observability as part of your scalable architecture. Instrument your code with structured logging, distributed tracing (OpenTelemetry), and metrics collection (Prometheus). Without these, you're flying blind once traffic scales beyond what you can test locally. Performance regressions in production become detectable within minutes rather than days. Observability isn't overhead; it's the infrastructure that makes ongoing optimization possible.
Architectural changes carry higher risk than code-level optimizations. Always pair them with comprehensive integration tests.
Frequently Asked Questions
?How do I read a flame graph to find hot paths in my code?
?Is refactoring for readability really worth it for performance gains?
?How much dev time is actually lost to skipping optimization early on?
?What's the biggest mistake beginners make when optimizing code?
Final Thoughts
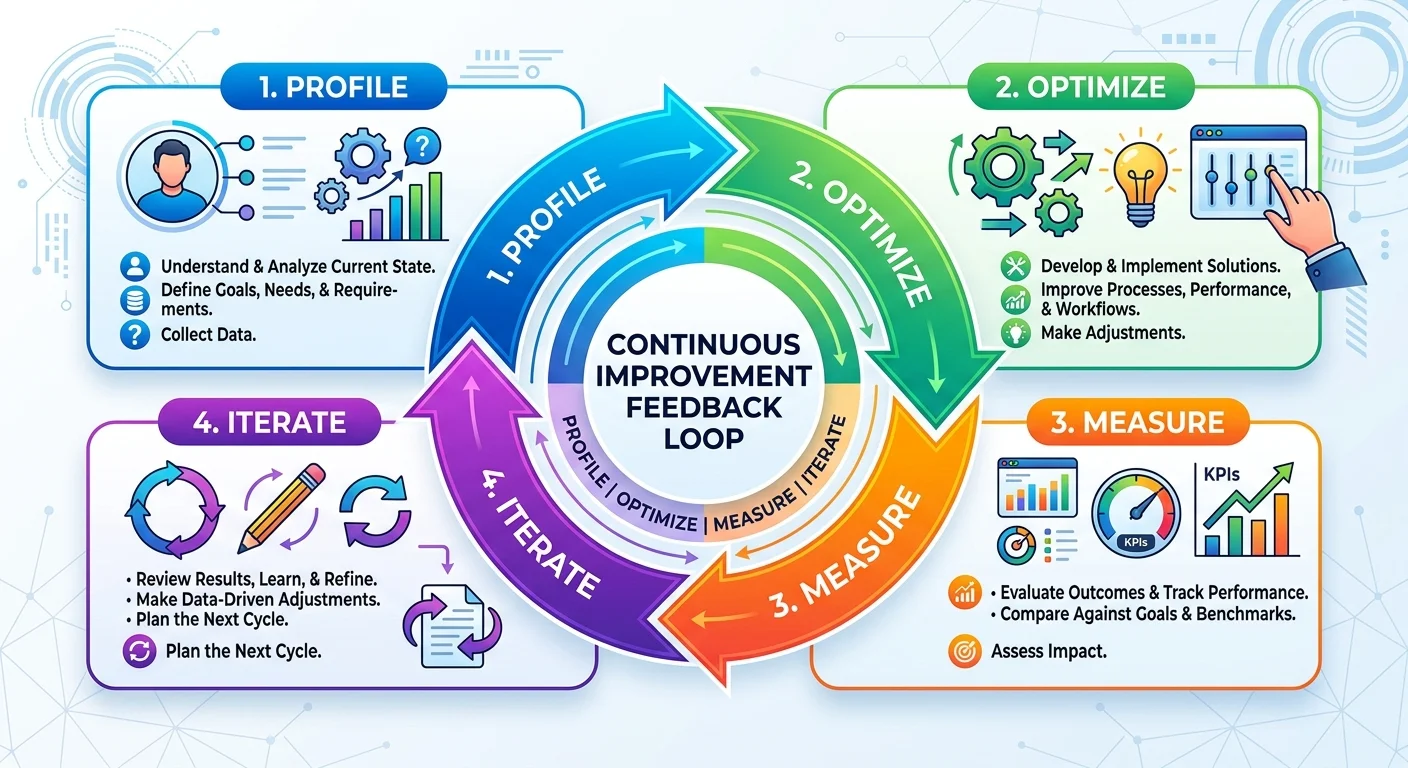
Effective code optimization starts with measurement, not guesswork. Profile your application, choose appropriate algorithms, refactor for clarity, and design your architecture with growth in mind. These four techniques cover the vast majority of performance wins you'll encounter in real projects.
None of them require exotic tools or esoteric knowledge; they require discipline and a willingness to question assumptions about where time is actually being spent. Build these habits now, and every codebase you touch will be faster, cleaner, and ready for whatever scale throws at it.
Disclaimer: Portions of this content may have been generated using AI tools to enhance clarity and brevity. While reviewed by a human, independent verification is encouraged.