Code optimization techniques refer to the systematic methods developers use to improve software performance, readability, maintainability, and scalability without altering the program's functional output. Whether you're refactoring a monolithic application or tuning a microservice, understanding these techniques is foundational to writing software that performs well under real-world conditions. The difference between a sluggish application and a responsive one often comes down to how thoughtfully the code was written and refined.
For intermediate to senior developers, optimization isn't an afterthought; it's a discipline woven into every stage of the development lifecycle. Ignoring it leads to technical debt, frustrated users, and systems that buckle under growth.
This article breaks down what code optimization actually means, how it works in practice, where developers commonly go wrong, and how you can apply these principles across your own projects. Think of it as the reference guide you wish someone had handed you three years into your career.
Key Takeaways
- Code optimization techniques target speed, readability, scalability, and maintainability simultaneously.
- Profiling before optimizing prevents wasted effort on non-critical code paths.
- Clean code practices reduce bugs and make future optimization significantly easier.
- Premature optimization causes more harm than neglecting optimization entirely.
- Scalable application development requires optimization at the architecture level, not just line-by-line.

How Code Optimization Works
Profiling and Measurement
Optimization starts with measurement, not guesswork. Profiling tools like Chrome DevTools, Python's cProfile, or Java's VisualVM reveal exactly where your application spends its time and memory. Without profiling data, developers often optimize the wrong functions, spending hours on code that accounts for less than 1% of total execution time. The first rule is simple: measure, identify bottlenecks, then act on data.
Once you identify hot paths, the real work begins. You examine loop structures, memory allocations, I/O operations, and database queries within those critical sections. A single N+1 query inside a loop can turn a 50ms response into a 5-second nightmare. Profiling doesn't just show you what's slow; it shows you why it's slow, which is the insight that transforms your approach to improving code performance across the entire application.
Algorithmic and Structural Changes
The most impactful code optimization techniques operate at the algorithm level. Replacing a bubble sort with a merge sort, switching from a linear search to a hash lookup, or introducing caching for repeated computations can produce orders-of-magnitude improvement. These aren't micro-optimizations; they're fundamental architectural decisions. A developer who understands Big O notation can often spot performance problems in code review before they ever reach production.
Structural changes also matter. Breaking a monolithic function into smaller, composable units improves both testability and performance isolation. When functions do one thing well, you can optimize, cache, or parallelize them independently. This approach aligns with clean code practices because it produces code that's easier to read, test, and tune over time. As IBM's documentation on code optimization explains, compiler-level optimizations also play a significant role, but they work best when the source code is already well-structured.
Always run a profiler before and after optimization to quantify actual improvement, not assumed improvement.
Why Optimization Matters: Use Cases and Impact
User Experience and Retention
Performance directly affects user behavior. Google has documented that a 100ms increase in page load time can reduce conversion rates by measurable percentages. Mobile users are even less patient; applications that take more than three seconds to load lose roughly 53% of visitors. These aren't abstract numbers. They translate directly into revenue, engagement, and customer trust for any product team shipping software to real users.
Beyond the frontend, backend optimization determines how many concurrent users your system can handle. A well-optimized API endpoint serving responses in 20ms can handle 50x the traffic of one taking 1000ms, assuming the same server resources. This is where scalable application development begins: not with more servers, but with better code. Optimization is the multiplier that makes your existing infrastructure stretch further.
Cost and Infrastructure
Cloud computing bills are directly tied to how efficiently your code runs. Unoptimized Lambda functions, bloated container images, and inefficient database queries all translate into higher AWS, GCP, or Azure invoices. One engineering team at a mid-size SaaS company reduced their monthly compute costs by 40% simply by optimizing their three most-called API endpoints. They didn't add infrastructure; they subtracted waste from their code.
Development workflow optimization also benefits from faster builds, quicker test suites, and shorter CI/CD pipeline execution times. When your test suite runs in 2 minutes instead of 20, developers commit more frequently, catch bugs earlier, and maintain momentum. The compounding effect of these small gains across a team of 10 or 20 engineers is substantial, often saving hundreds of developer-hours per quarter.
Optimization ROI varies. Always prioritize the changes that affect your most-used code paths and most-expensive infrastructure components first.
Common Misconceptions About Code Optimization
The Premature Optimization Trap
Donald Knuth's famous warning about premature optimization remains widely cited but frequently misunderstood. He wasn't arguing against optimization itself. He was arguing against optimizing code before you understand where the actual bottlenecks are. Developers sometimes use this quote as an excuse to write sloppy code, which is the opposite of its intent. Writing clear, well-structured code from the start is not premature optimization; it's professional discipline.
"Writing clear, well-structured code from the start is not premature optimization; it's professional discipline."
The real danger is spending three days hand-tuning a function that runs once during application startup while ignoring the database query that fires 10,000 times per hour. Premature optimization misdirects effort. Informed optimization, guided by profiling and user impact data, directs it precisely where it matters. The distinction is about timing and evidence, not about whether optimization itself is valuable.
Readability vs. Performance
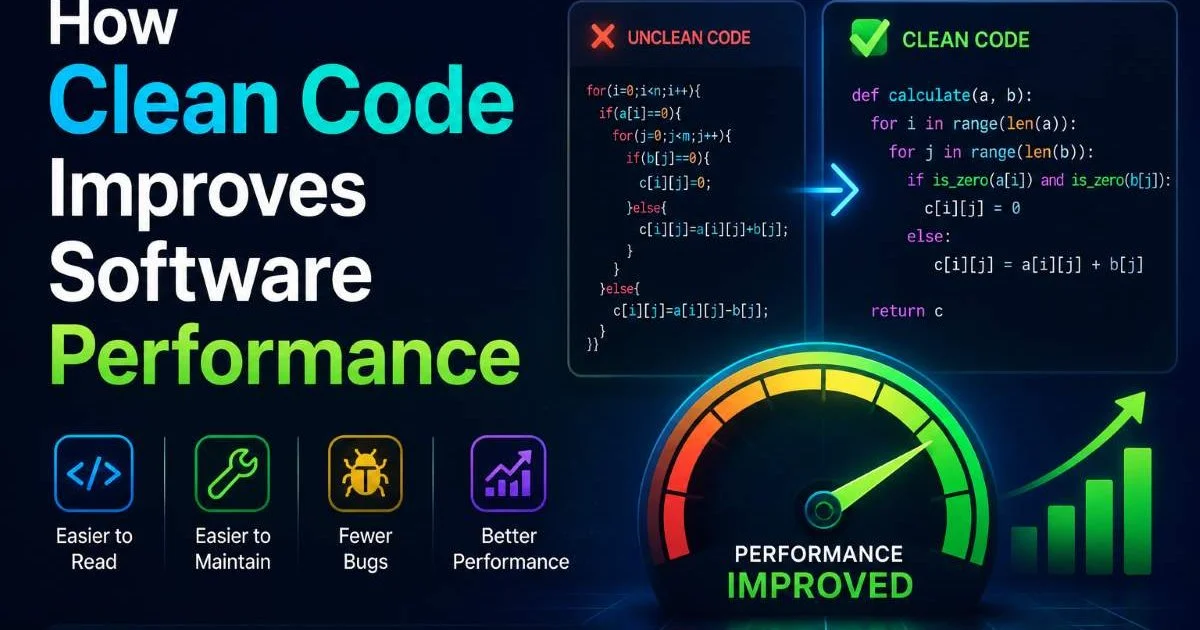
A persistent myth suggests that optimized code must be harder to read. In reality, the best code optimization techniques often improve readability. Replacing a nested loop with a well-named utility function, using appropriate data structures, or eliminating redundant computations all make code both faster and clearer. Code readability tips from experienced engineers consistently emphasize that readable code is easier to optimize because developers can actually understand what it does.
There are exceptions, of course. Low-level systems programming, game engine inner loops, and high-frequency trading systems sometimes require sacrificing readability for raw speed. But for 95% of application development, readability and performance are allies, not enemies. When you write code that clearly expresses its intent, future developers (including future you) can identify optimization opportunities that obscure, clever code would hide completely.
If your optimization makes code unreadable to your teammates, document it thoroughly or reconsider the approach.
How Code Optimization Relates to Similar Concepts
Refactoring and Optimization
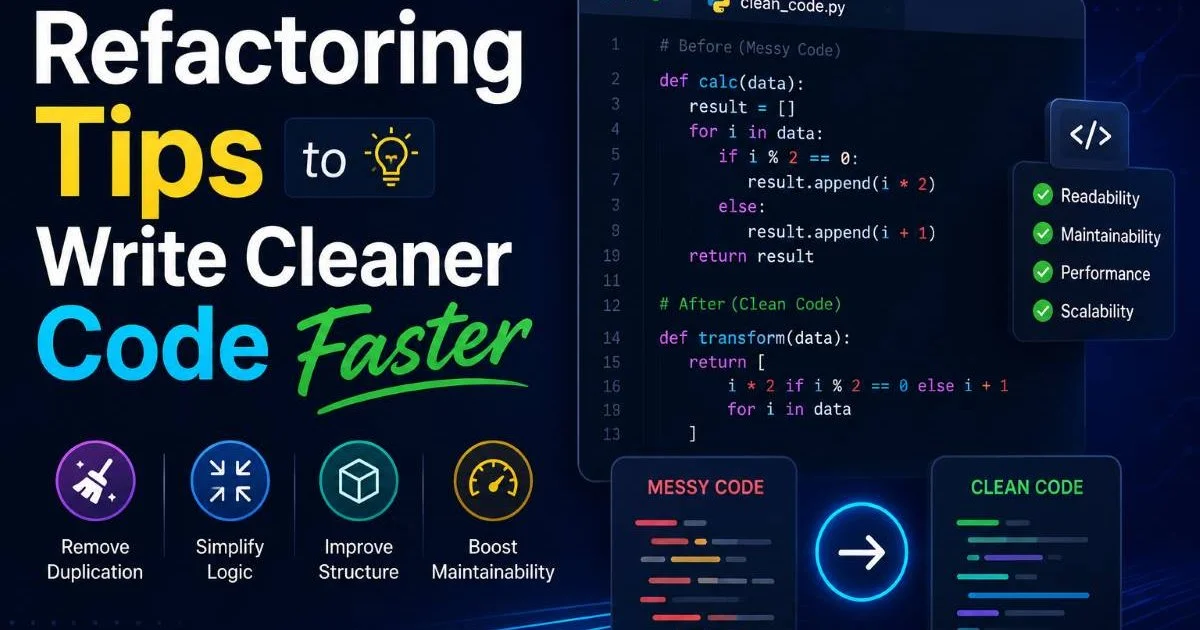
Refactoring and optimization are related but distinct activities. Refactoring restructures code without changing its behavior, primarily targeting maintainability and clarity. Optimization changes how code executes to improve performance. They often overlap: a refactoring session that breaks apart a 500-line method frequently exposes caching opportunities or redundant computations. The smartest teams treat refactoring as the preparation step that makes targeted optimization possible and safe.
Martin Fowler's refactoring patterns, for instance, directly enable better performance work. Extract Method, Replace Temp with Query, and Introduce Parameter Object all create code that's easier to profile and tune. When your functions are small and focused, you can swap out an O(n²) implementation without risking side effects across the codebase. Clean code practices and optimization feed each other in a virtuous cycle that pays dividends over the entire life of a project.
DevOps and Workflow Integration
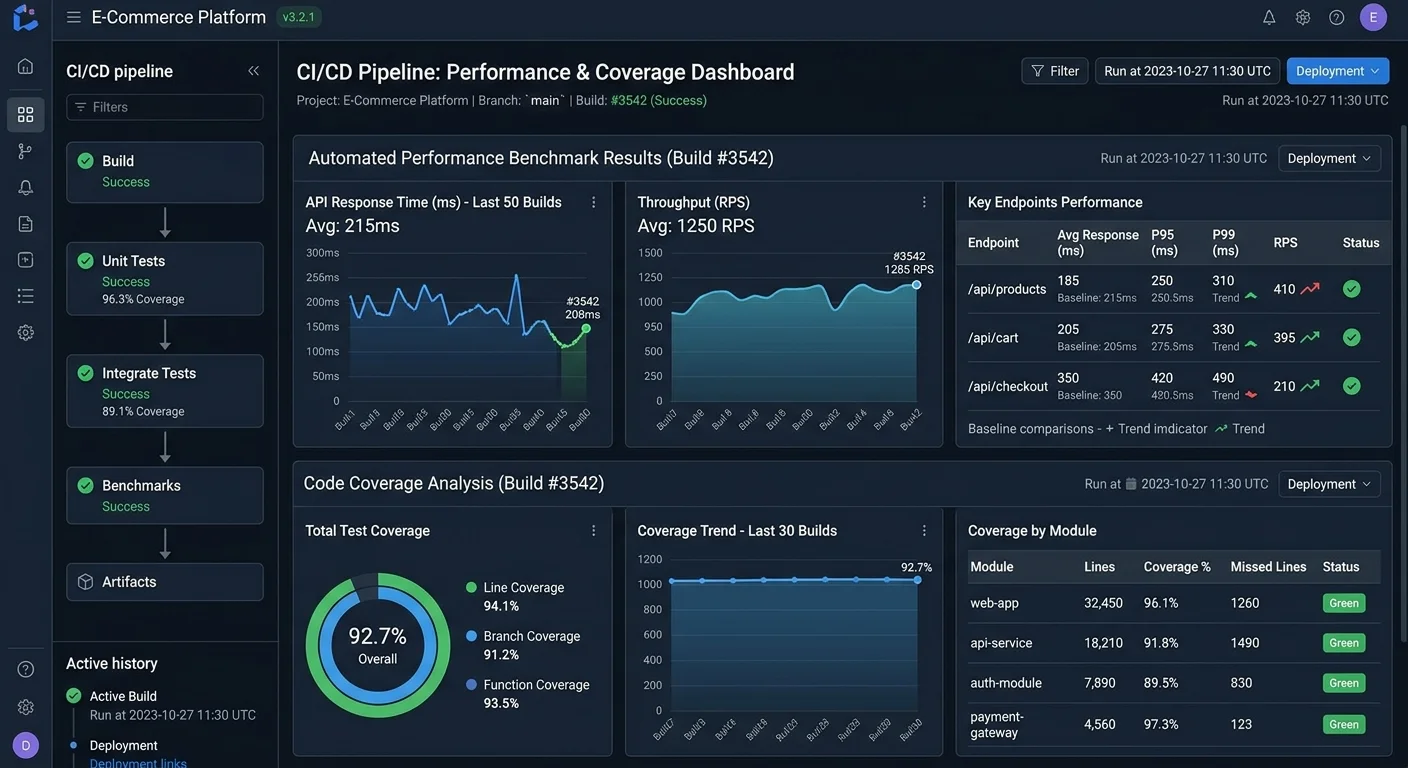
Modern development workflows integrate optimization into continuous delivery pipelines. Performance budgets, automated lighthouse audits, and regression benchmarks catch slowdowns before they reach production. Tools like MCP servers for coding are emerging as part of the AI-assisted development ecosystem, helping teams automate repetitive optimization tasks and identify patterns across large codebases that human reviewers might miss.
The shift-left philosophy applies to performance just as it does to security and testing. Running benchmarks in CI means every pull request includes performance data alongside functional test results. Teams practicing development workflow optimization this way rarely face surprise performance crises in production because they've been tracking trends continuously. The overhead of adding these checks is minimal compared to the cost of a production incident caused by a slow query that shipped unnoticed through three sprints.
| Category | Technique | Typical Impact | Complexity |
|---|---|---|---|
| Algorithmic | Better data structures | 10x to 100x speedup | Medium |
| Caching | Memoization, Redis | 5x to 50x speedup | Low to Medium |
| Database | Query optimization, indexing | 2x to 20x speedup | Medium |
| I/O | Async operations, batching | 3x to 15x throughput | Medium |
| Compiler | Optimization flags, inlining | 1.2x to 3x speedup | Low |
| Frontend | Code splitting, lazy loading | 2x to 5x load time | Low |
Start with caching and database optimization for web applications. These two categories typically yield the highest return for the least effort.
Frequently Asked Questions
?How do I use profiling tools to find real bottlenecks in my code?
?Is refactoring the same thing as code optimization?
?How much time does fixing an N+1 query problem actually save?
?Why is premature optimization considered harmful if performance matters?
Final Thoughts
Code optimization techniques are not a one-time activity or a specialist's domain. They belong in every developer's toolkit, applied with judgment and backed by measurement. The best-performing teams treat optimization as a continuous practice: profile regularly, fix what matters most, and keep the codebase clean enough that future improvements remain straightforward.
Start with your slowest endpoint, your most expensive query, or your longest build step. Measure the before, make a targeted change, and measure the after. That cycle, repeated consistently, is how good software becomes great software.
Disclaimer: Portions of this content may have been generated using AI tools to enhance clarity and brevity. While reviewed by a human, independent verification is encouraged.